In a world more and more driven by data, it only makes sense that we need a simple means of digesting it all.
Collecting and storing data is the easy part. The challenge is making the data tell a story that engages people and inspires them. The fact is that data is only useful when it helps people or an organization do something better.
When data are communicated in ways that are easy for people to grasp and in contexts the audience understands, the data more effectively persuades, offers insights, and provides guidance. This concept, also known as data visualization, has seen explosive growth and it goes well beyond static pie charts and infographics.
Faculty members, Mike Kowal (Fellow in Digital and Computational Studies) and Mike Franz (Assoc. Professsor of Government) presented data sources and polling information at a “Lunch and Learn” panel discussion hosted by the Academic Technology & Consulting group.
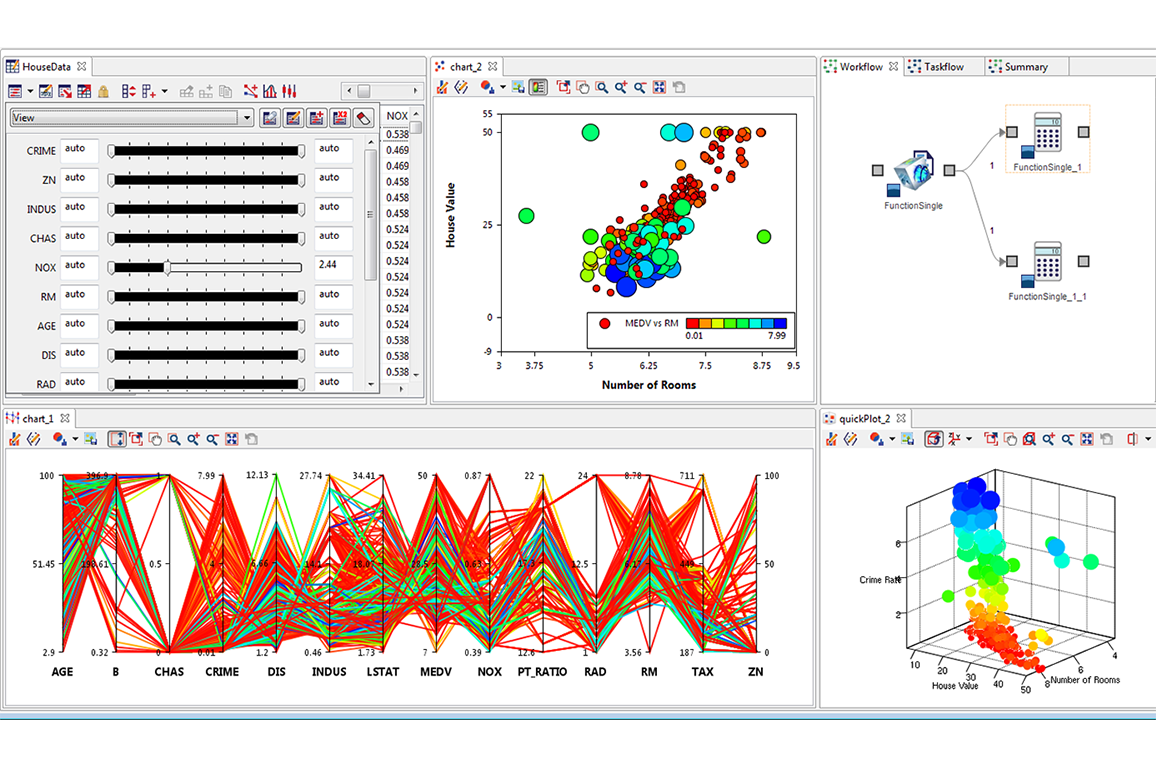
Kowal uses a variety of tools to introduce data visualization concepts. For example, Gephi.org is an open-source platform that features graphs with dynamic filtering and advanced social network metrics. Kowal has used it for analyzing and predicting how networks evolve over time.
Data visualization crosses academic disciplines. Kowals “Campaign Data in the 21st Century” attracts Math and Computer Science majors as well as Government and Behavioral Science students. Last year, students used data visualization in a history-based project—they used ArcGIS software to virtually recreate the terrain around the Battle of Gettysburg as Joshua Chamberlain would have experienced it.
According to Kowal, visualization techniques are critical to helping students understand the data they are collecting and make it meaningful. Examples of the ways students are presenting data appear in Bowdoin’s Campaign Data Blog from November.